
Know where your time and revenue actually go.
Time, billing, realization, aged receivables, and revenue trends. Built-in, filterable, exportable. Filter by client, user, or service. Export to Excel.
The reports firms actually run
Time, AR, billing, realization, revenue, and capacity. Built in, filterable, exportable. No build, no consultant.
Find leaky margins
Realization compares billable vs actual hours so you can spot scope creep before it eats the engagement.
Plan with real numbers
Revenue trends and capacity forecasts answer the pricing and hiring questions partners actually ask.
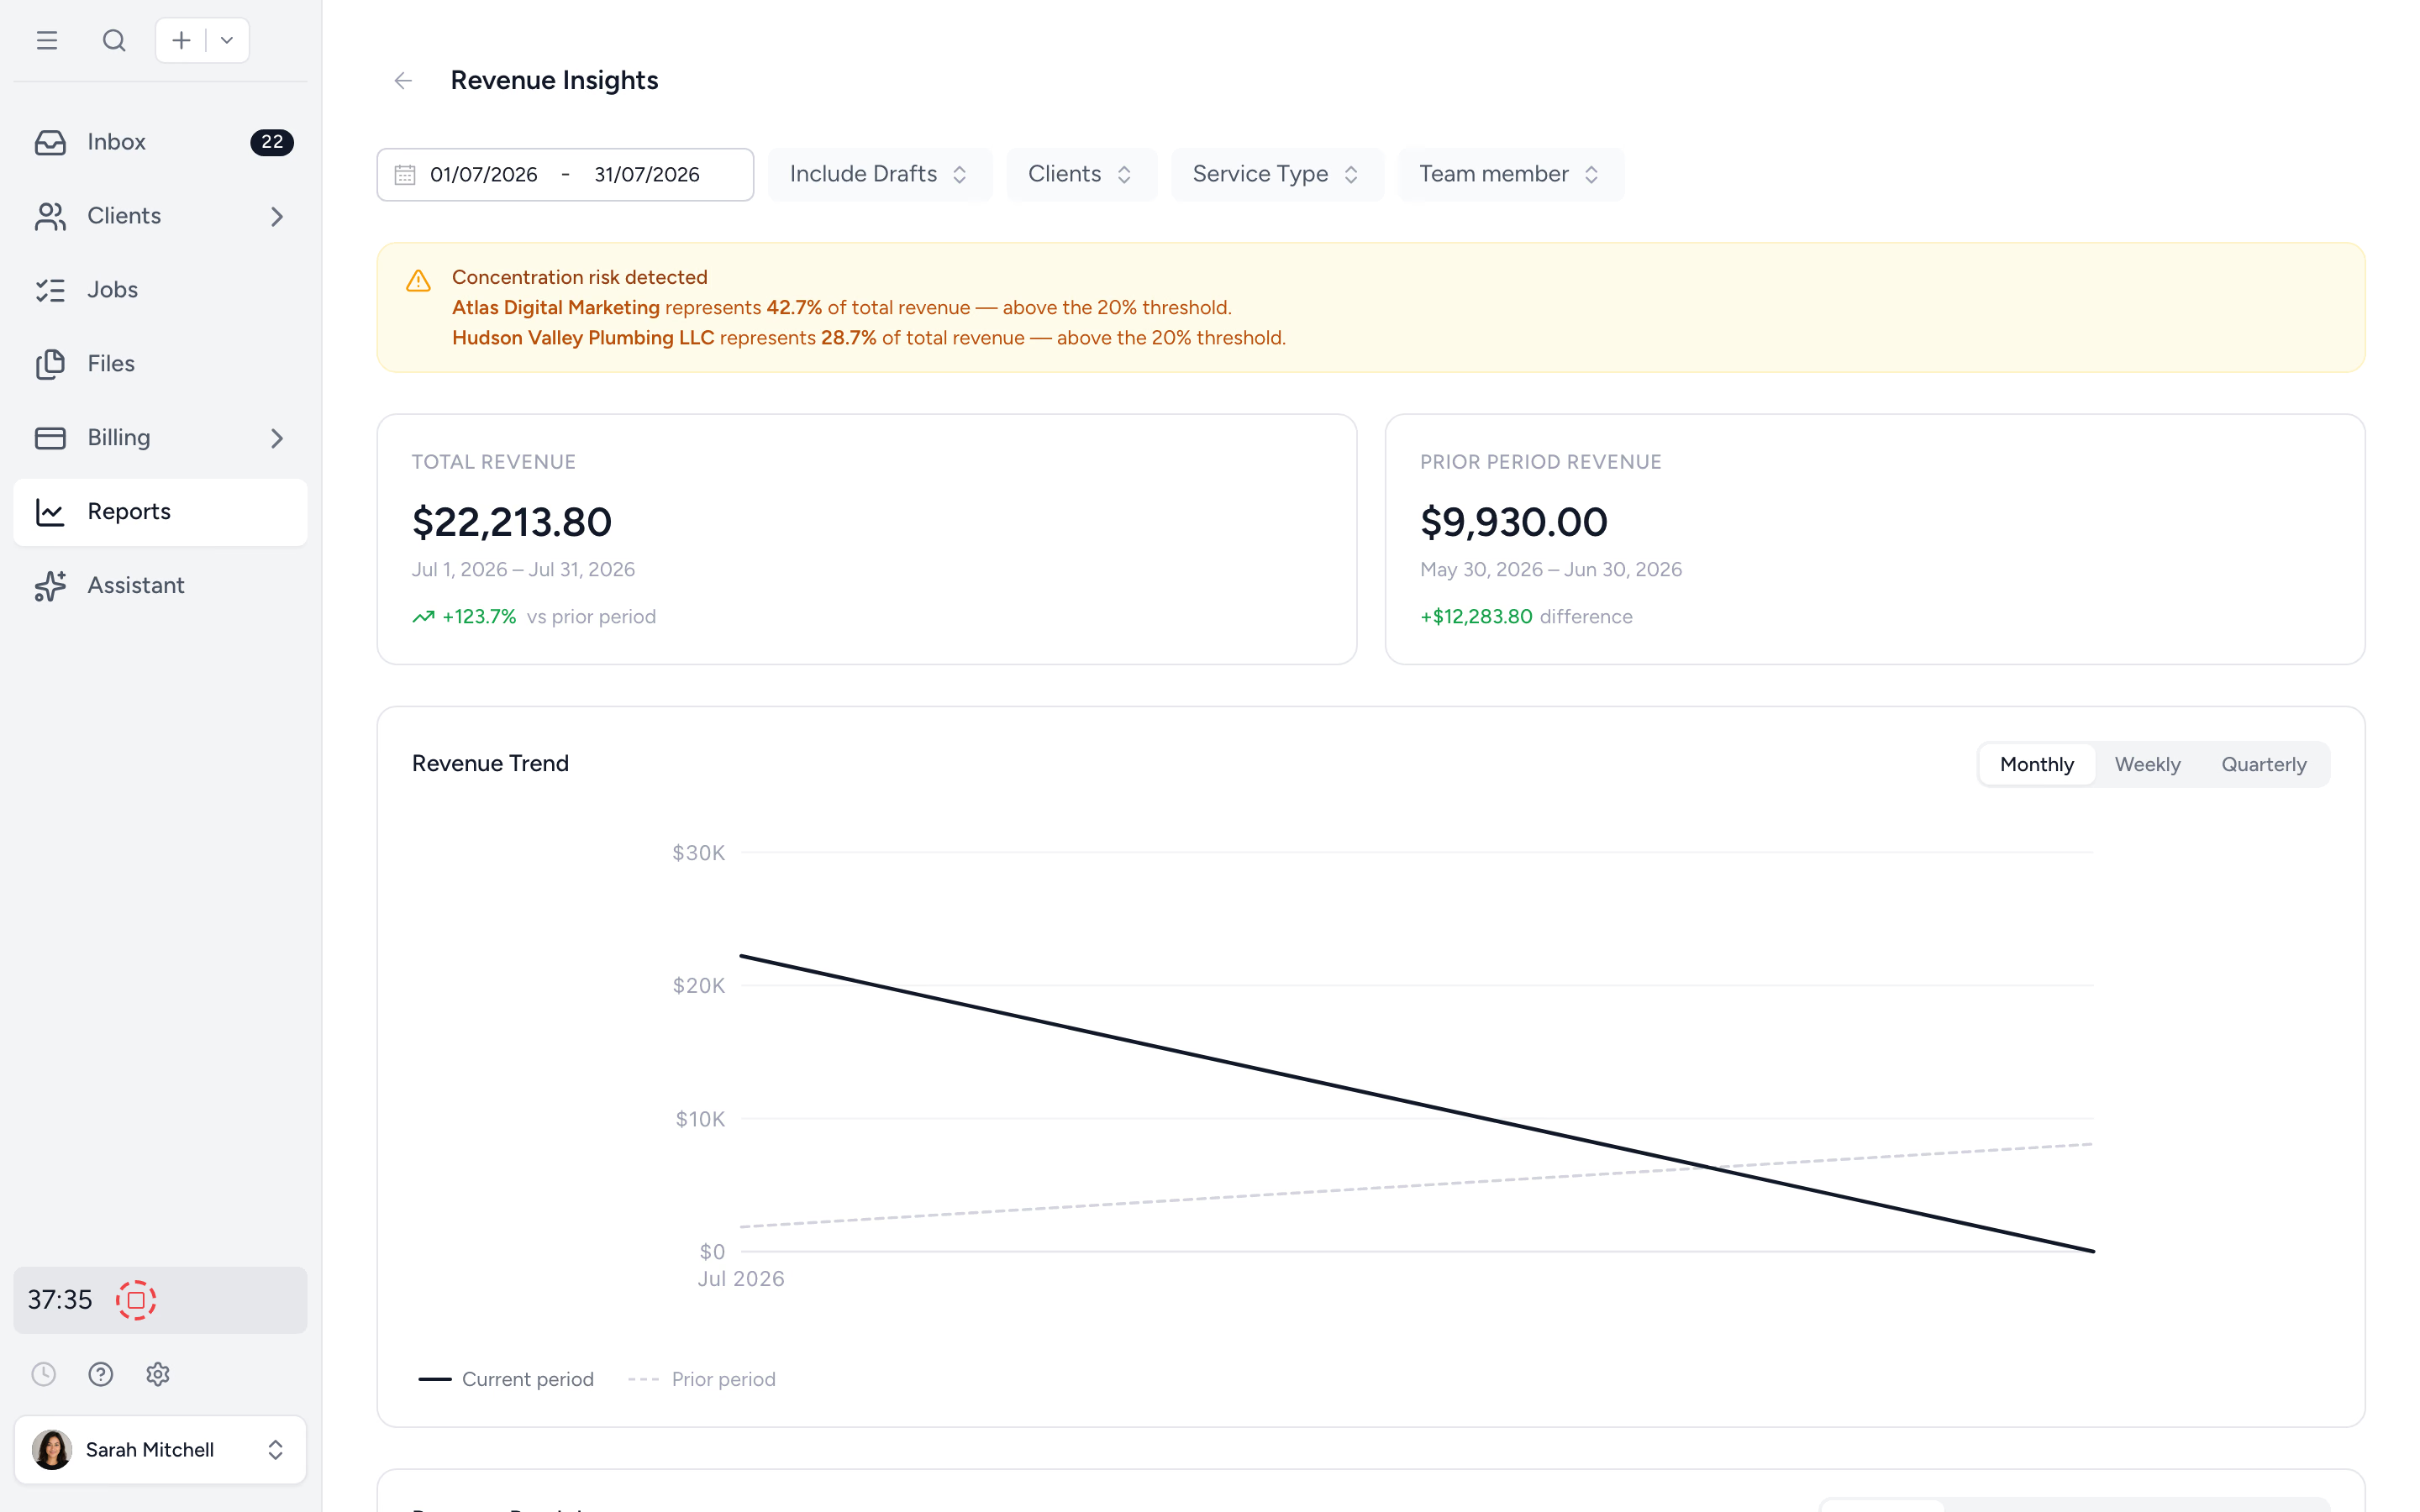
See how revenue trends across periods.
Revenue insights pulls billed revenue per period and visualises the trend. Spot the slow quarter coming. Plan the price increase. Answer the partner question without exporting to Excel first.
- ✓ Trend across months and quarters
- ✓ Filter by client, service, or employee
- ✓ Restricted to admin and owner roles
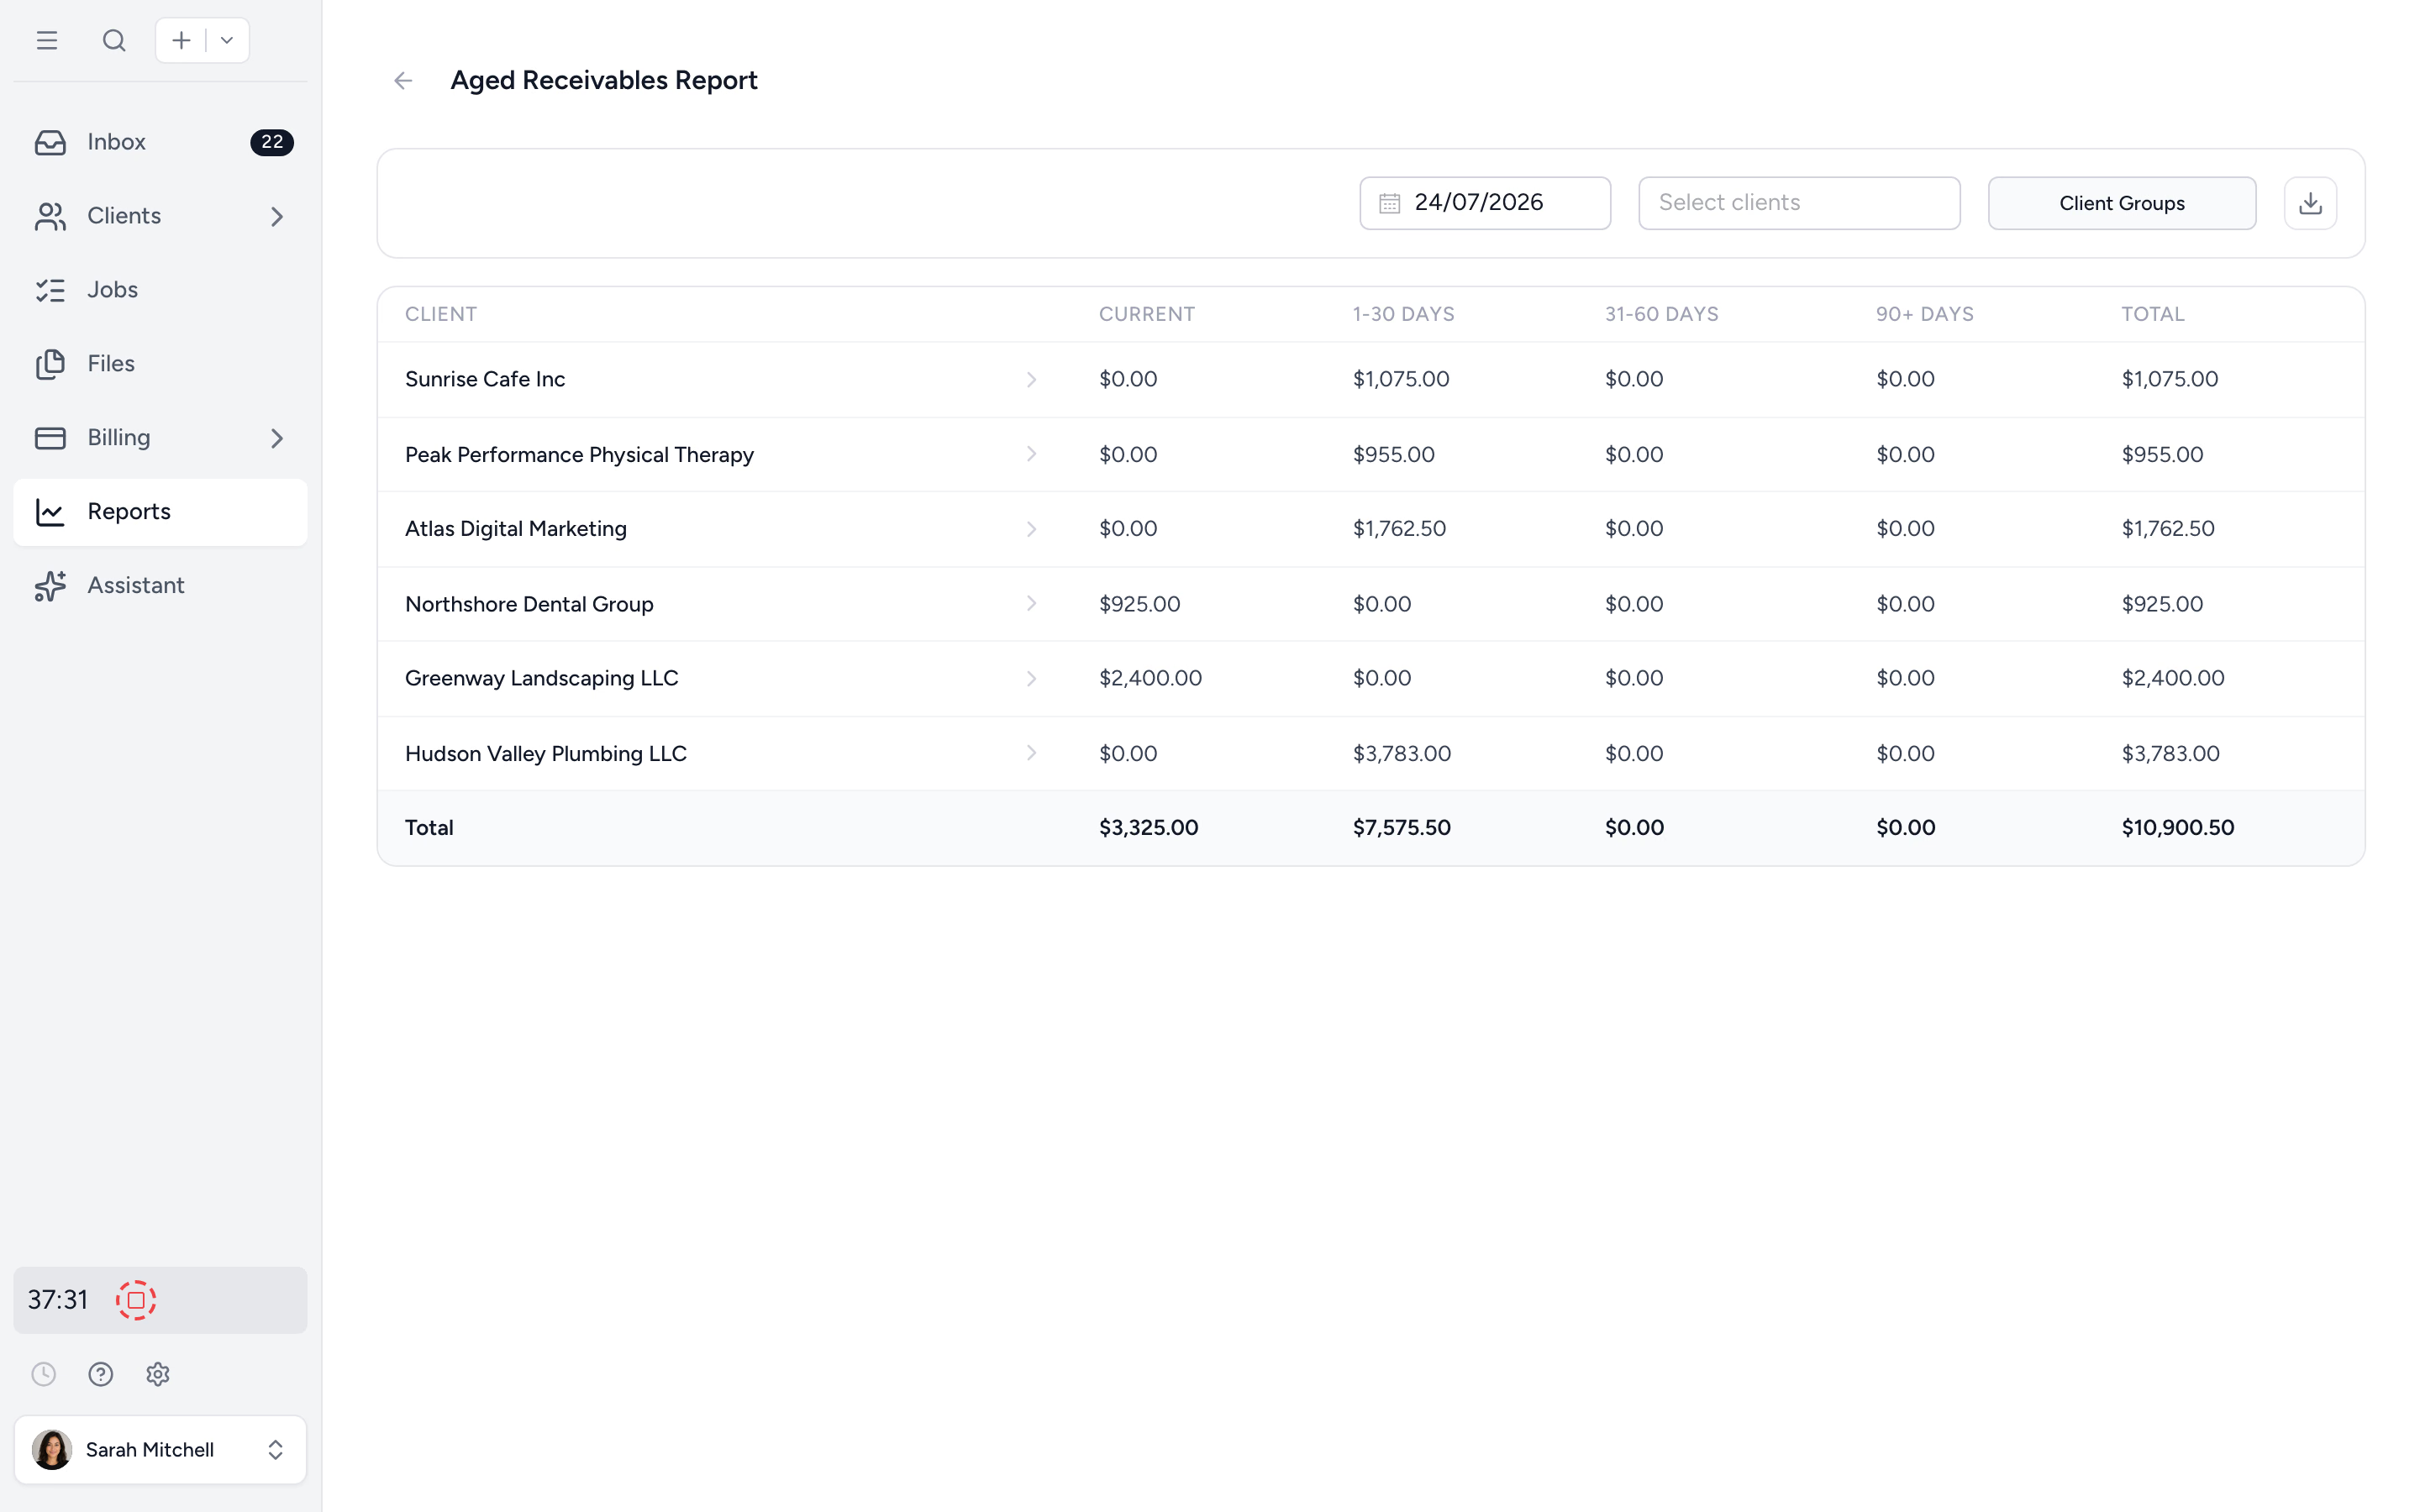
Know exactly who owes you what, and how long.
Bucketed at current, 30, 60, and 90+ days. Group by client, service, or owner. Drill into the oldest balances first. Hand the list to whoever owns AR this week.
- ✓ Bucketed AR aging
- ✓ Group by client, service, or owner
- ✓ Export to Excel for partner meetings
Find scope creep before it eats the margin.
Realization compares billable hours to actual hours by job, client, service type, or employee. Spot the engagement that's quietly running 40% over. Spot the service line that always realises low. Adjust pricing or scope before the next quarter.
- ✓ Realization by job, client, or service
- ✓ Filter by employee or date range
- ✓ Find leaky margins by team or service line
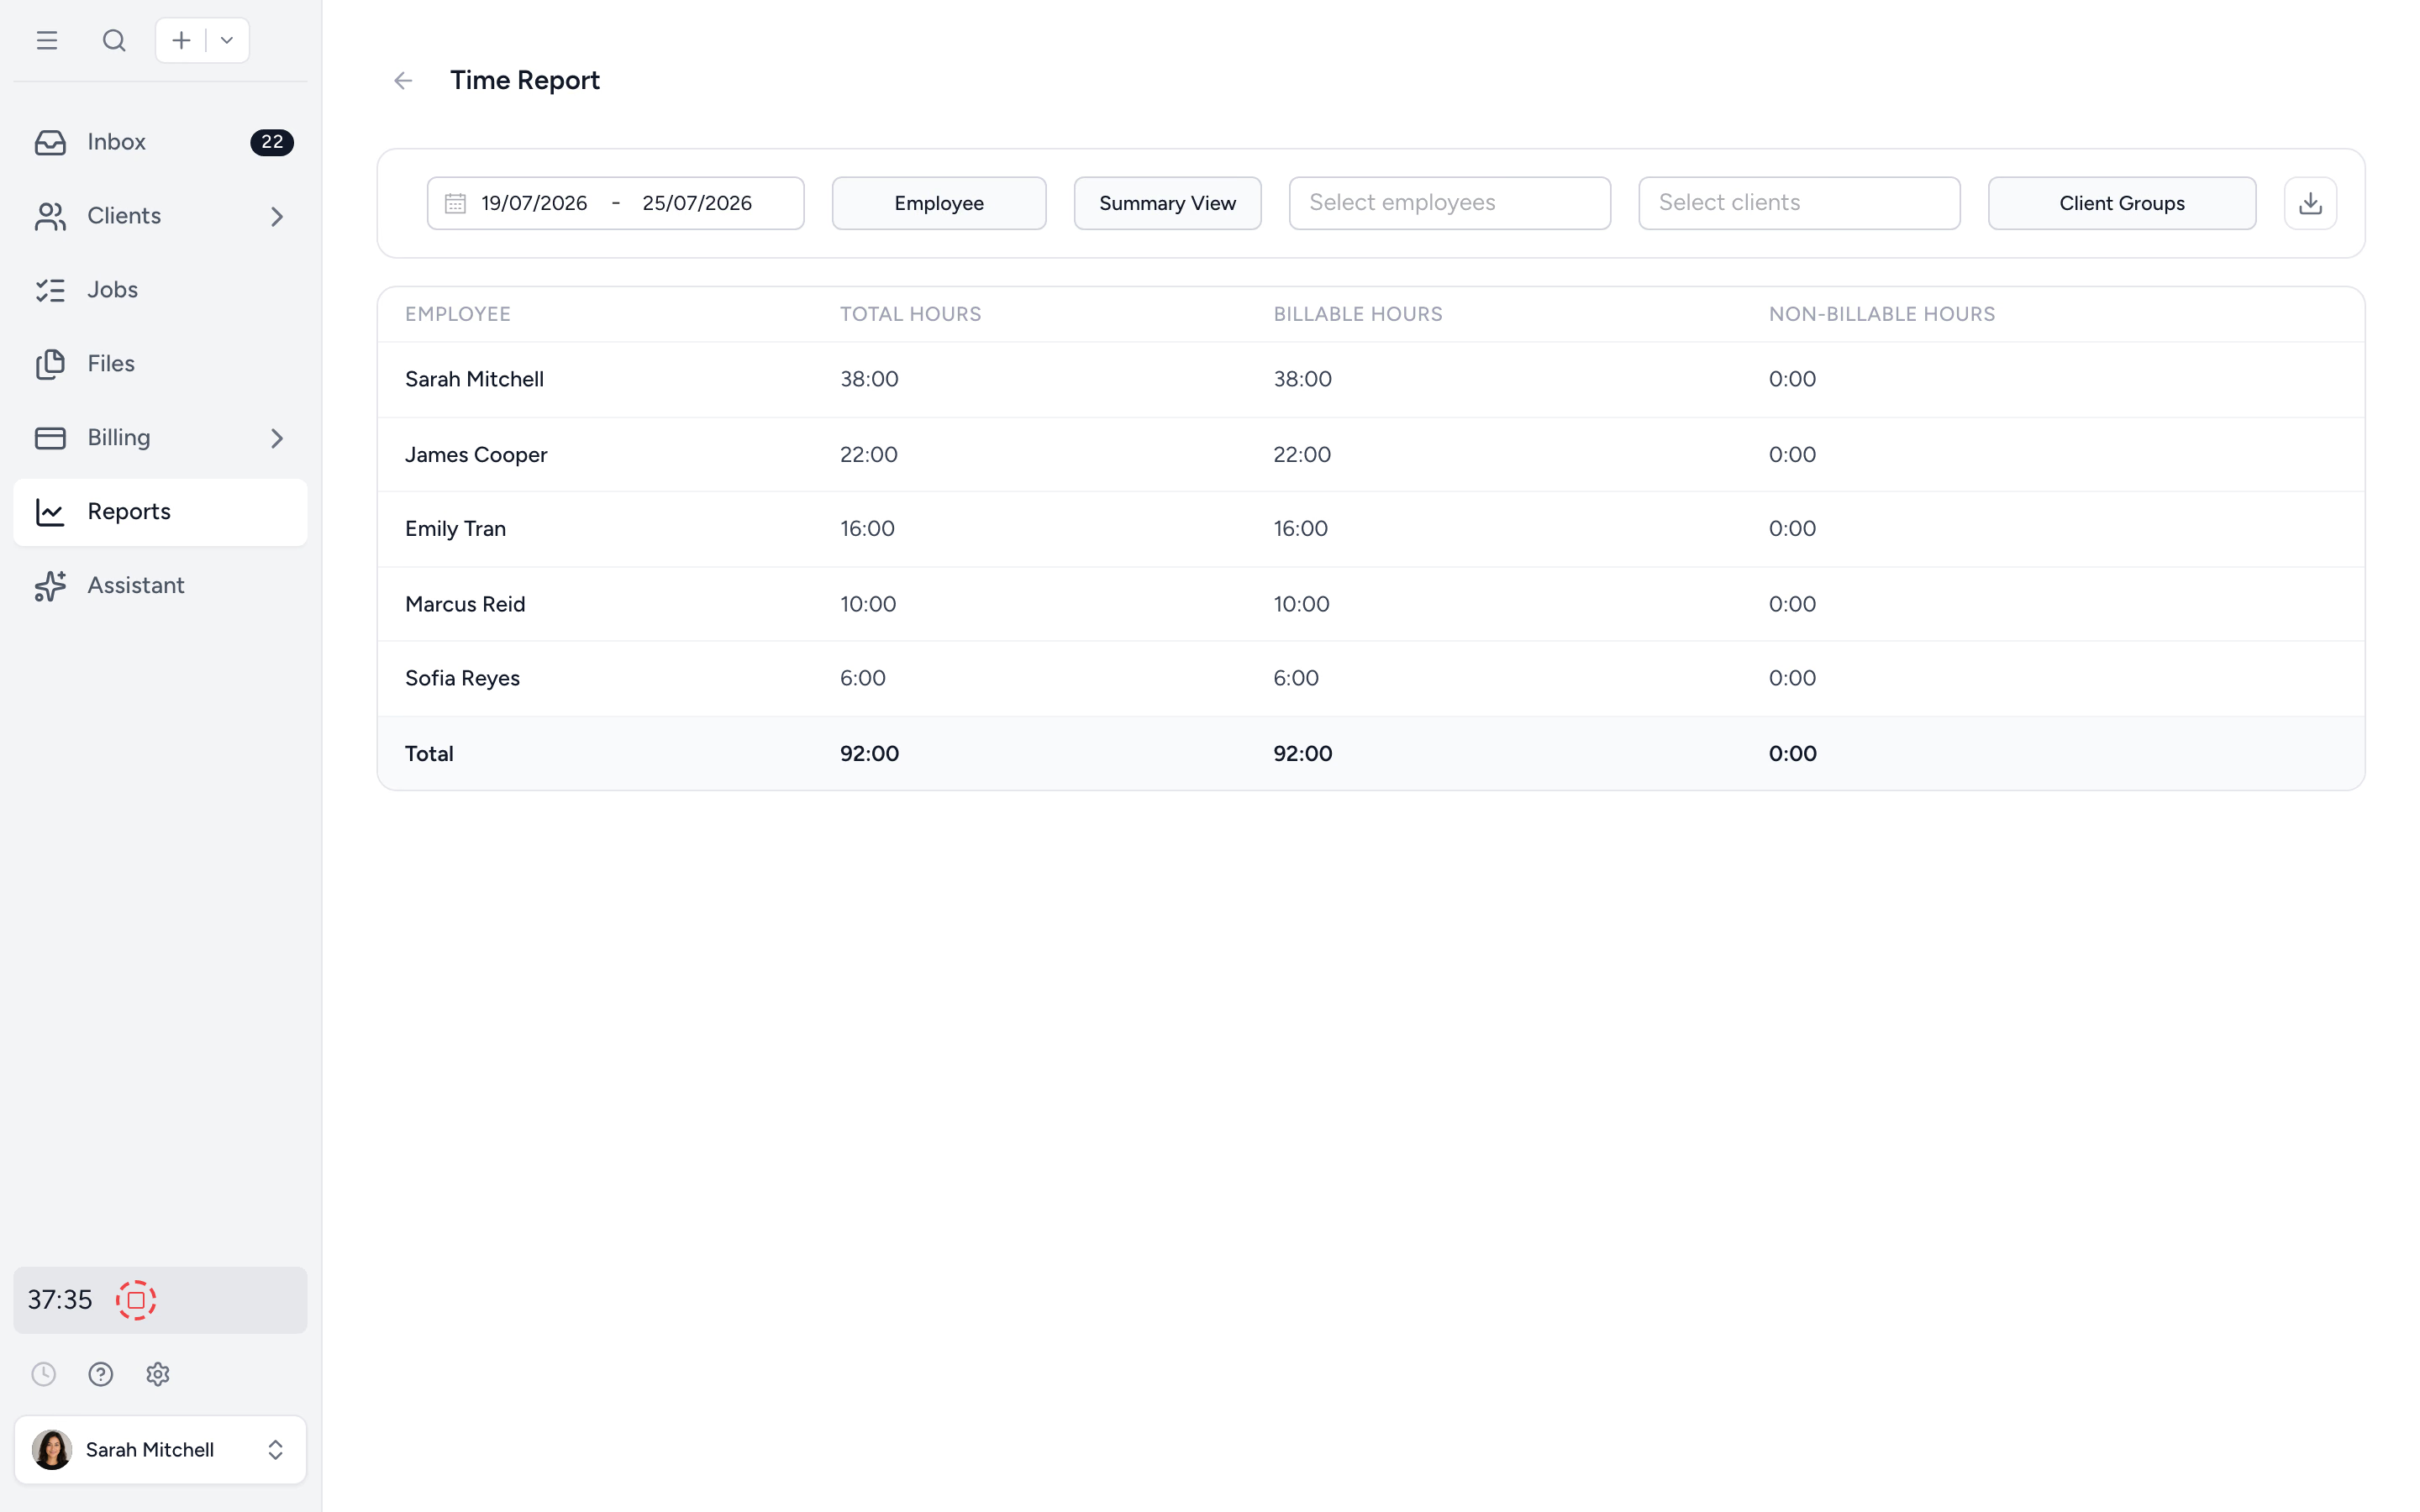
Time and billing, in one report set.
Time summary aggregates hours by employee, client, or service. The Time report shows estimated job hours alongside actual time logged, so you can spot jobs running over budget at a glance. Billing report shows invoiced revenue. Time entries report drills to every individual log. Filter, export, share. No analyst required.
- ✓ Time summary & time entries
- ✓ Budget vs actual hours, by job
- ✓ Billing report by client, user, or service
- ✓ Date-range filter on every report
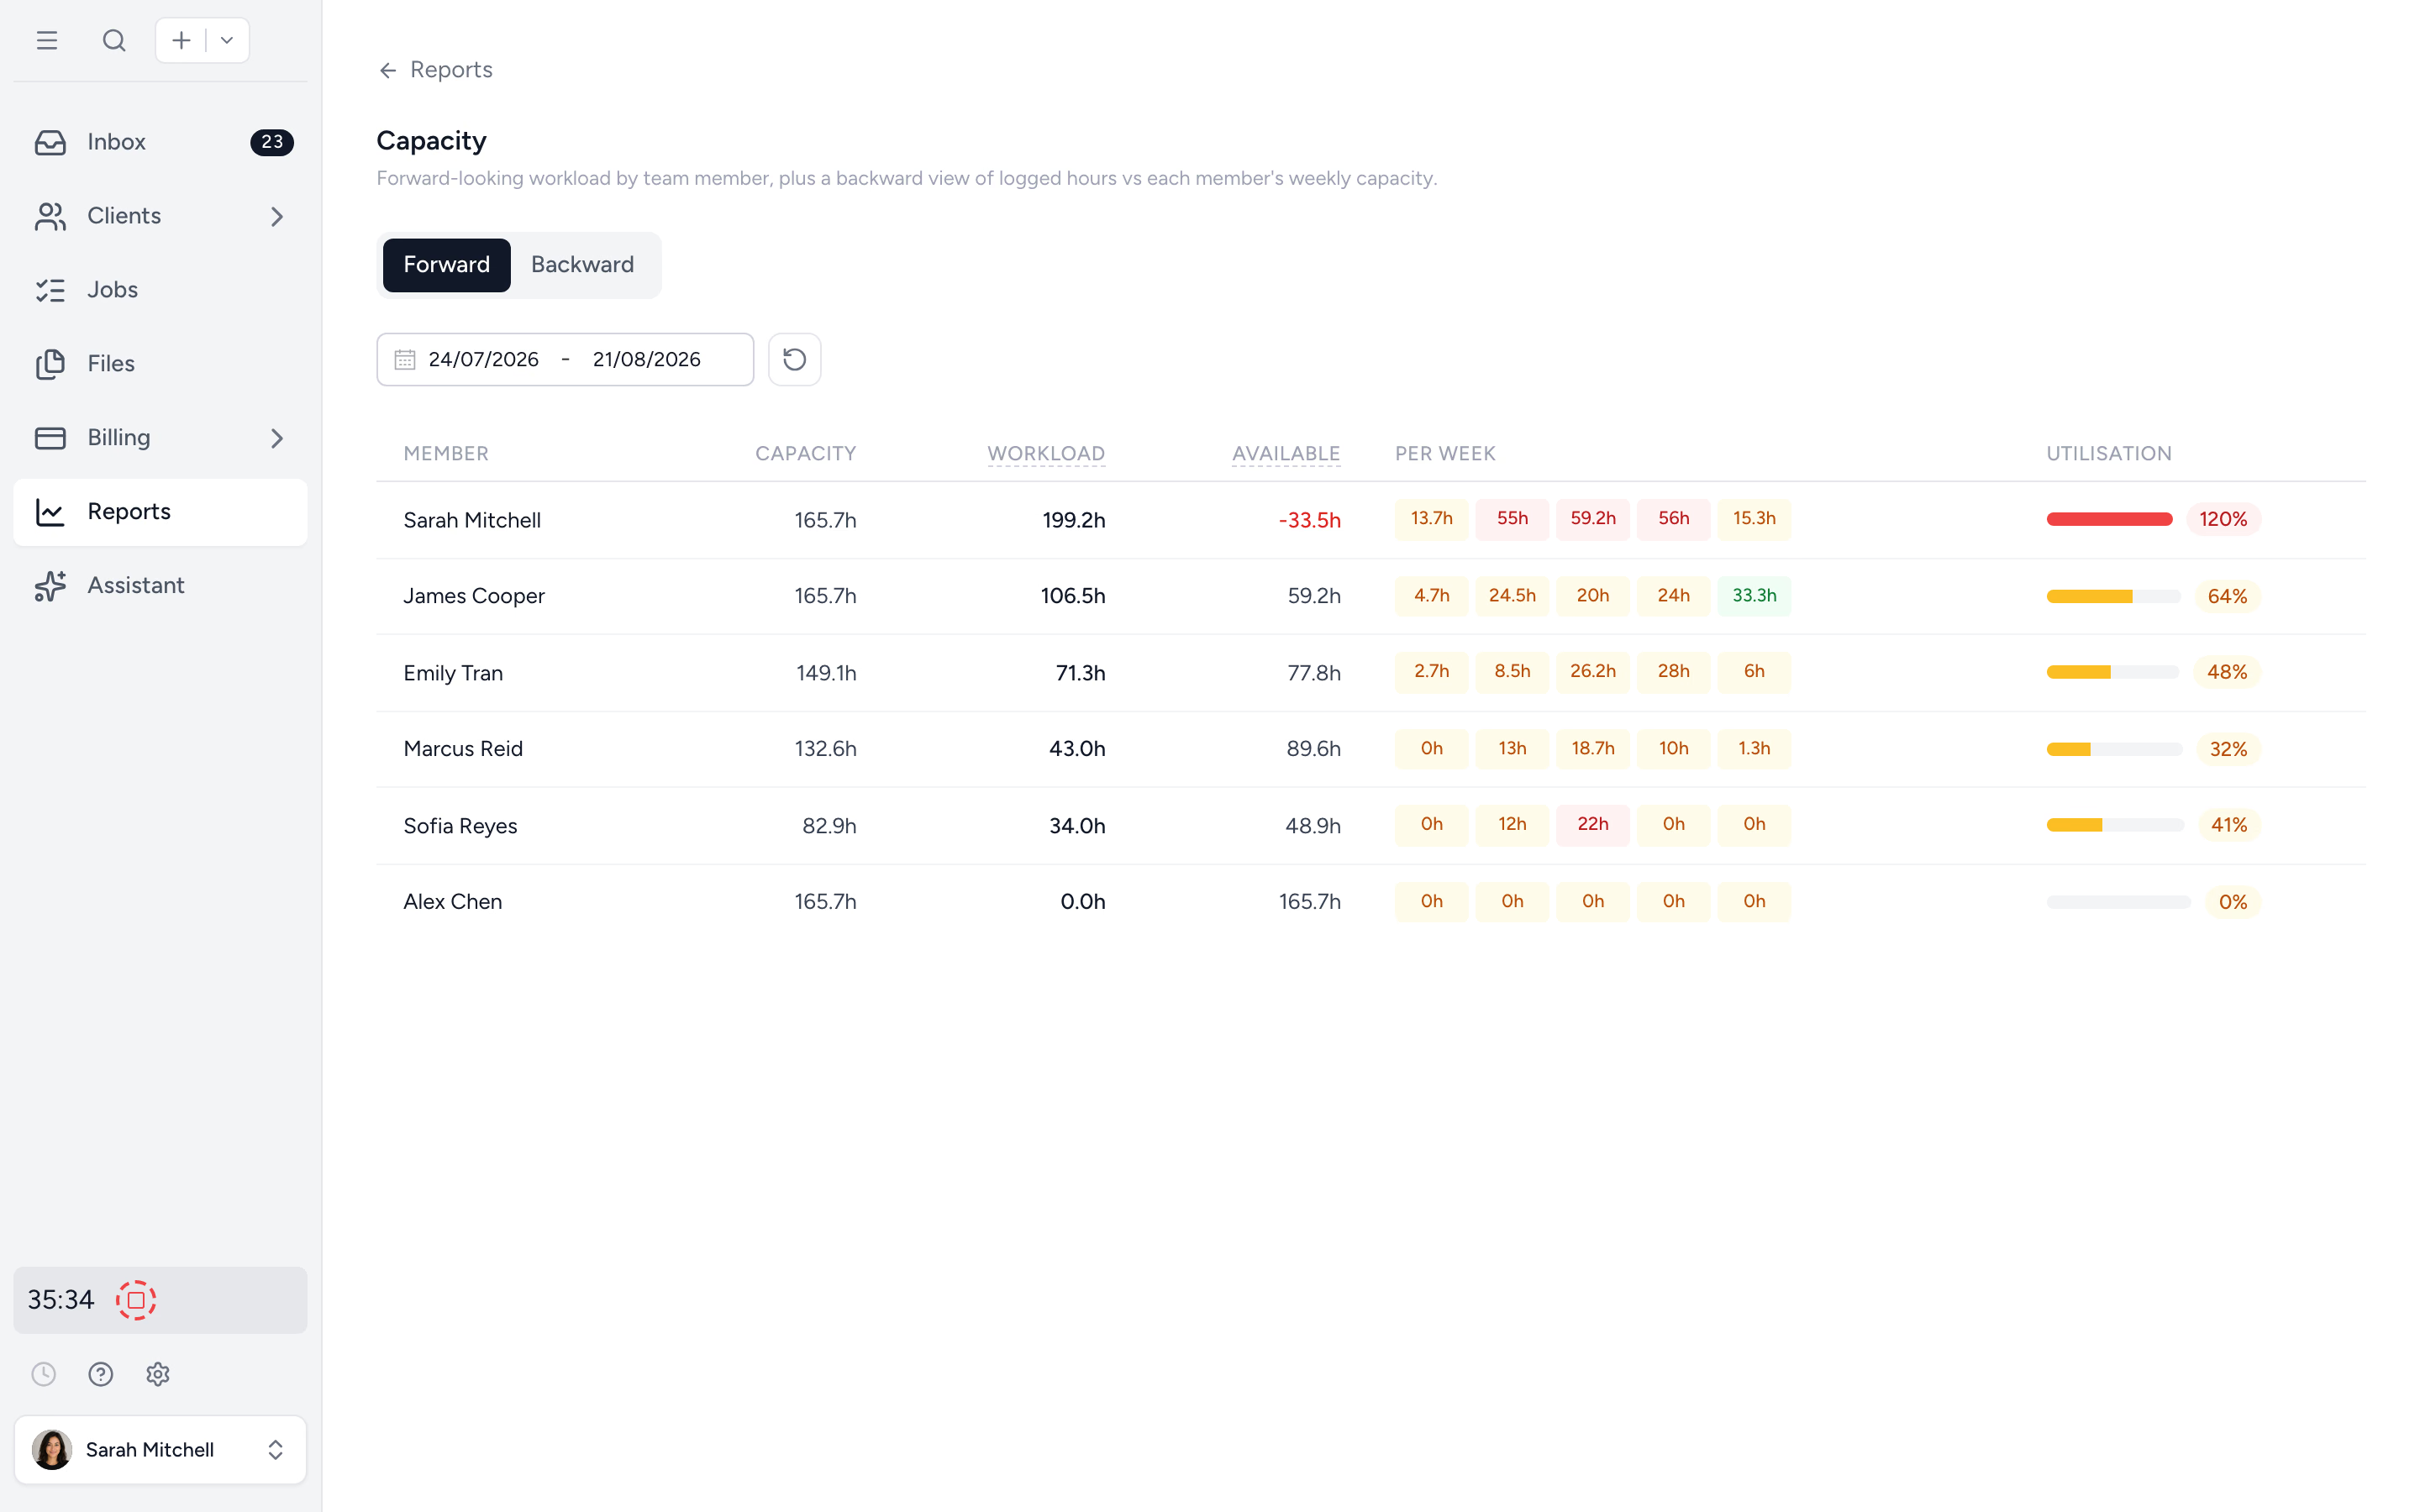
Forecast workload by team member.
Capacity Planning forecasts upcoming workload, week by week, and looks back at utilisation trends. Perfect partner for billing and realization: bill more, plan smarter, hire on the right signal.
- ✓ Forward and backward views
- ✓ Per-member drill-down
- ✓ Recurring jobs projected forward
From "we should look at the numbers" to a real answer, in four steps.
- 1
Track time and bill
Reports populate from the work and invoices already in Tidyflow.
- 2
Open a report
Pick from time, AR, billing, realization, revenue, capacity.
- 3
Filter and group
By client, user, service type, or date range.
- 4
Export or share
One click to Excel for partner meetings or working papers.
What changes when reports live where work lives.
Without Tidyflow
- ×Export time to Excel, then build the realization report
- ×Pivot tables for AR aging, refreshed weekly
- ×Revenue trends in PowerBI, owned by one person
- ×Reports show last week's data, not today's
With Tidyflow
- ✓Built-in reports across time, billing, AR, capacity
- ✓Live data, no refresh required
- ✓Excel export when you need it
- ✓Role-based access for sensitive numbers
Trusted by accounting firms making decisions on real data.
"Overall, everything just works, whether that be time recording, deadline management, monitoring WIP, billing … client portal, digital signatures, and many other features that a small accounting or bookkeeping practice needs."
"Tidyflow is easy to use, and has a simple, modern UI. Their customer support is amazing."
"The user-friendly interface and solid features have become essential in streamlining our accounting firm's operations, ensuring consistent and reliable service delivery."
"Great for team collaboration, accountability, keeping track of information and ensuring nothing falls through the cracks."


Built for the questions firms actually ask.
Time
- Time summary
- Time entries detail
- Budget vs actual hours
- Realization, billable vs actual (Pro)
- WIP report
Billing
- Billing report
- Aged receivables
- Revenue insights (Pro)
- Filter by client / service / user
- Excel export everywhere
Capacity (Pro)
- Forward capacity
- Backward utilisation
- Per-member drill-down
From $29/user/month, billed annually.
Time, billing, and receivables reports are on every plan. Pro adds realization, revenue insights, and capacity.
Reporting questions firms ask us most.
Time tracking, time entries, aged receivables, billing, realization, revenue insights, and capacity. All filterable by client, employee, service type, or date range. Realization, revenue insights, and capacity are on the Pro plan.
Yes. Every report exports to Excel for further analysis, partner meetings, or audit working papers.
Yes. Sensitive reports (billing, realization, revenue insights) are restricted to admin and owner roles. Staff only see what they're entitled to.
Realization compares billable vs actual hours by job, client, employee, or service. It's how you find scope creep, leaky margins, and pricing that no longer works.
Yes. Revenue insights show trend data across periods. Capacity shows future workload. Combined, they answer pricing and hiring questions with real numbers.
See where your firm's revenue actually lives.
Start free for 14 days. No credit card. Get your first report in minutes.
Explore more features
Workflow management
Recurring jobs, templates, and deadlines your team can't miss.
Client management
Every client, contact, and detail in one organized place.
Proposals & Engagement Letters
Branded proposals and engagement letters, signed online.
Billing & Payments
Invoice from tracked time or fixed fees, and get paid online.
Time tracking
Timers and timesheets that flow straight into billing.
Document management
Secure, organized document storage, shared with your clients.
Client portal & requests
Clients upload, answer, and approve in one portal. Reminders chase for you.
Tax organizers
Digital organizers with conditional questions and last year's answers.
Email Management
A shared firm inbox, connected to your clients and jobs.
Artificial Intelligence
An assistant, agent teammates, and MCP connectors on your firm's live data.
Capacity Planning
See your team's workload before it hits.
Integrations
Xero, QuickBooks Online, Zapier, Make, and a public API.
Electronic signatures
Legally binding e-signatures, included at no extra cost.
Collaboration
Comments, mentions, and shared visibility on every job.
See the full feature list →
Compare every capability across plans, side by side.